How crypto risk assessment metrics evolved: market cap, TVL, and the probability of loss
•11 min read
Share in social
Intro
In February 2019, a small Ethereum group called Concourse Open Community launched DeFi Pulse. At the time, the entire DeFi sector held $277 million, and about 90% of it sat in one protocol: MakerDAO. DeFi Pulse needed a way to rank protocols, and the question was simple: where is the money? Their answer was Total Value Locked.
But TVL wasn't the first number crypto rallied around. Before it, there was market cap. Before market cap, there were forum threads and gut feelings. Each phase followed the same pattern: pick the clearest available signal and treat it as the measurement of projects’ attractiveness.
None of these metrics was built to measure risk. They measure size, activity, and price. The gap between those signals and actual risk has cost the industry tens of billions of dollars.
How crypto projects were assessed before market cap and TVL existed
Before DeFi, there was no TVL, as nothing was “locked” on-chain in the way we think about it now. And the way people judged projects from 2009 to 2018 shows how little progress was made on risk.
From 2009 to 2013, during the Bitcoin-only years, assessment was mostly tribal. You went to BitcoinTalk, read the whitepaper if there was one, checked whether the developer had a post history, and watched hashrate growth as a rough signal of network confidence. There was no CoinMarketCap, CoinGecko, or DeFiLlama. Just forum threads, GitHub, and instinct. Smart contract audits weren't a topic because smart contracts didn't exist yet.
And blockchain security, such as it was, had a peculiar property: Bitcoin was being stress-tested in public, every day, by everyone. This is a kind of permanent, open-source penetration test that the SHA-256 mining network performed by design. If the cryptography or consensus had failed, someone would have taken all the assets. The fact that it held up became the proof.
That didn't stop people from losing money. In June 2011, a BitcoinTalk user had 25,000 BTC stolen from a compromised computer. By July 2012, “pirateat40” had run Bitcoin Savings and Trust, the first Bitcoin Ponzi scheme, collecting at least 700,000 BTC before disappearing. Mt. Gox, which handled around 70% of Bitcoin trading by 2013, was quietly drained between 2011 and 2014; by the time it collapsed, 850,000 BTC were gone. Rug pulls didn't need smart contracts, just trust and a forum account.
When altcoins appeared: Litecoin in 2011, Peercoin in 2012, Ripple in 2012 — the checklist grew slightly: consensus mechanism, block time, total supply, premined tokens. But “due diligence” still meant reading an announcement thread, scanning GitHub, and deciding whether a pseudonymous founder sounded credible.
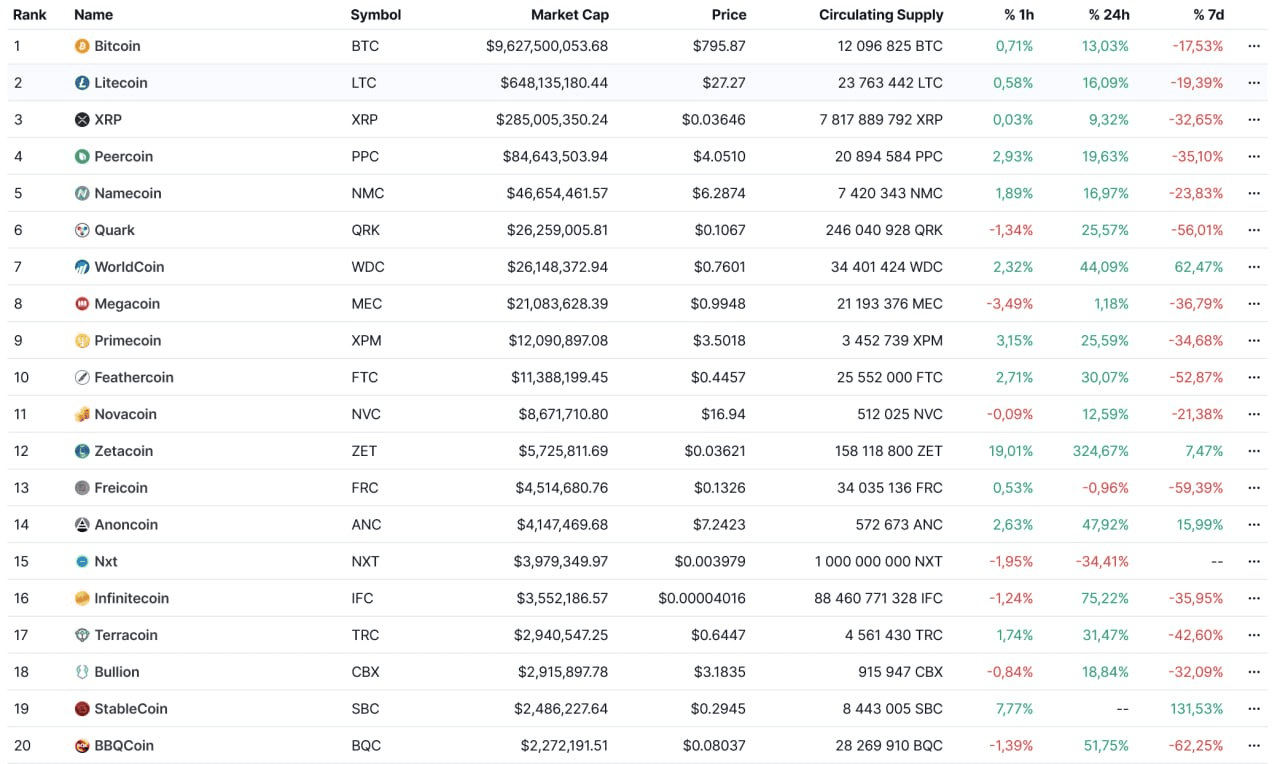
Then in May 2013, Brandon Chez launched CoinMarketCap, and crypto got its first universal scoreboard: market capitalization. MCAP = Price multiplied by circulating supply. In December 2013, total crypto market cap was about $13 billion across 42 coins. By late 2017, it reached $800 billion across thousands.
Market cap became the default language: projects were ranked by it, investors sized opportunities by it, and media cited it. Yet, it told you one thing: the market's current price for the circulating tokens. A token with a $500 million market cap and no product looked identical on CoinMarketCap to a $500 million token backed by a working solution and a public team.
The early market logic was simple: scarcity equals value. Keep circulating supply low, and the project looks small but expensive per token. Release too many tokens, and the price collapses under selling pressure. Teams learned to play with that balance: restrict supply to push up per-token price, or burn tokens to create scarcity. Whether the project actually worked was not part of the formula.
The ICO scam era and the limits of market cap
The 2017 ICO boom exposed market cap's blind spots. Then the industry carried on as if nothing had happened.
Projects raised billions with little more than a PDF. Due diligence meant scanning LinkedIn profiles, checking advisory boards, skimming a roadmap, and judging how technical the whitepaper sounded. Token design was treated as optional homework: supply schedule, inflation, vesting, treasury allocation were details for the few who bothered. Most buyers looked at two things: the hard cap and the presale discount. By most estimates, more than 80% of ICOs ended as scams or abandoned projects. On CoinMarketCap, they sat side by side with serious teams, ranked by the same math.
Ethereum's 2015 launch made the next phase possible. Smart contracts could now hold and move funds without a middleman. MakerDAO shipped in late 2017. Compound launched in 2018. Uniswap went live in November 2018. For the first time, protocols were actually holding user funds on-chain for lending, liquidity, and yield. You could see how much ETH or DAI sat in a contract. And these projects could not be measured by multiplying the native token price by its supply. That visibility made a new metric possible, and in February 2019, Concourse Open Community introduced TVL: one number to compare protocols.
The shift is worth naming explicitly. In 15 years, crypto assessment moved from "read the forum thread" to "check the market cap on CoinMarketCap" to "check the TVL on DeFi Pulse." Each step gave the market a cleaner scoreboard and made comparison easier.
What market cap and TVL actually tell you, and where they stop
Market cap
Market cap is basic math: price multiplied by circulating supply. It doesn't tell you whether demand is real or propped up by thin liquidity and wash trading.
The gap between circulating supply and fully diluted valuation (FDV) makes this worse. A token with 10% in circulation can look stable until vesting unlocks hit, and when the rest enters the market, the picture changes fast. Teams have every reason to boost rank for visibility, and the difference between circulating and total supply rarely makes the headline.
Market cap tells what the market is paying right now for the tokens in circulation, nothing more.
The TVL
TVL looks more concrete because it counts dollars in smart contracts. But the same dollar can be counted multiple times: one asset staked in Lido, borrowed on Aave, deposited in Curve. TVL also can't separate long-term capital from yield hunters who move the moment rewards drop. When emissions end, liquidity often follows.
Asset prices distort it further. If ETH falls 50%, a protocol's TVL can fall 50% even if no one withdraws. And there's no universal standard: one aggregator excludes governance tokens, another includes them. The same protocol shows different TVL figures depending on who is counting and how they define "locked." TVL feels precise. But when you go into details, it isn't.
Size is not health
Market cap and TVL both measure scale. They do not measure governance, key management, legal exposure, security practices, or dependency risk. They don't tell you whether one founder controls the treasury. These numbers tell you where capital sits today. They don't tell you how safe it is or how long it will stay.
The evolution of Web3 risk indicators: from audits to proof of reserves
Not to by hypocritical, we must state, that market did react to each disaster with a countermeasure for risk.
After the DAO hack ($50M), Coincheck ($534M), and Ronin ($625M), audits became mandatory indicator of safety. "Audited" turned into a badge every project had to display.
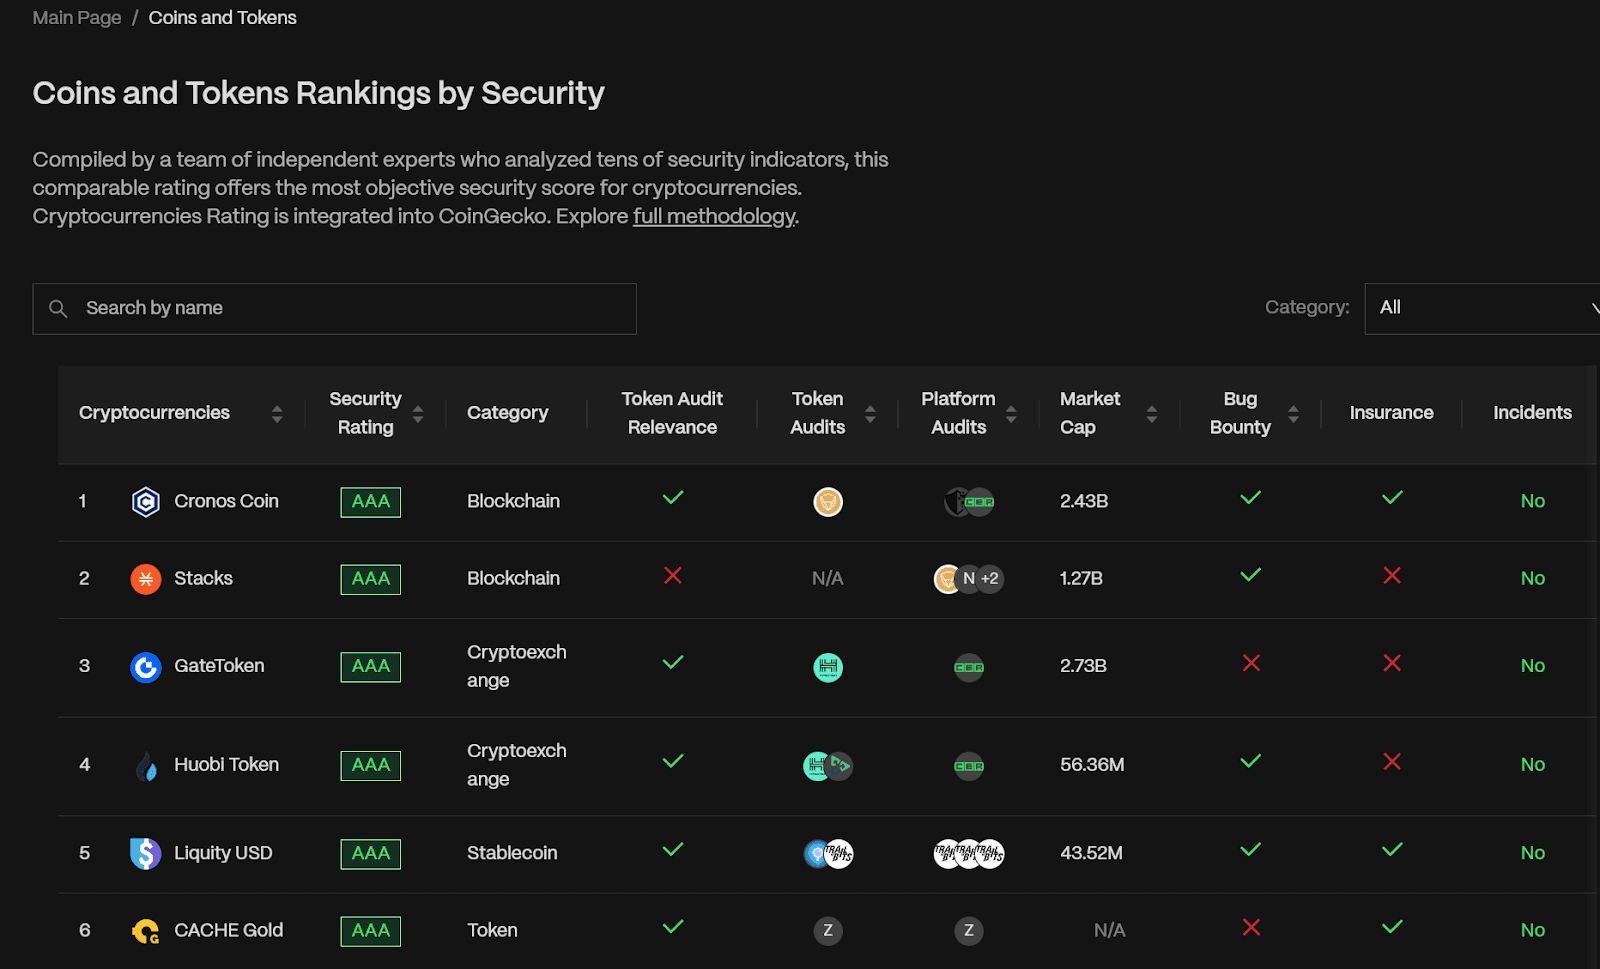
In 2018, CER.live began rating exchange cybersecurity across more than 18 indicators, and by July 2020, those scores fed into CoinGecko's Trust Score. For the first time, users could see a public security rating attached to major platforms. Between 2020 and 2021, the number of exchanges with audits and bug bounty programs doubled.
Then FTX lost $8 billion in ten days. The new FTX CEO, John Ray, described it as a "complete failure of corporate controls." No audit would have caught that because the issue sat below the code: governance, accounting, internal controls. The response was Proof of Reserves, and it addressed the specific weakness FTX exposed, namely hidden balance sheet risk.
But there's a useful place to check what actually drains capital: the insurance claims. Nexus Mutual is the largest on-chain insurer in crypto. It has paid over $18M since 2019, and its full claims history is public, on-chain, verifiable by anyone.
The cases it paid out on tell one story. Arcadia Finance lost $3.6M (2025) through an input validation flaw in its Rebalancer contract. Euler Finance lost $197M (2023) to a flash loan exploit. Rari Capital lost $80M (2022) to a reentrancy bug. These are code problems. Audits exist to catch them. Sometimes they do, sometimes they don't (mostly breaches happen outside of the audit coverage), but at least the risk and the protection live in the same category.
Now look at what Nexus Mutual's policy will not cover: stolen private keys, phishing, insider fraud, rug pulls, and any situation where the protocol itself worked as designed but the people operating it didn't. Read that list again. That's the majority of how money actually disappears in crypto right now. In February 2025, Bybit lost $1.5 billion because the Lazarus Group compromised the signing infrastructure. Not a single line of contract code malfunctioned. In May 2025, Cetus Protocol lost $223M because of a bug in a third-party math library called integer-mate that Cetus's own developers never wrote and likely never audited. Neither case was insurable.
The pattern we see is the industry fixes the last failure with a new metric or measure. Audits didn't stop FTX. Proof of Reserves doesn't fix poor key management. Each solution closes one gap and leaves others open.
How probability of loss measures what TVL and market cap cannot?
Summarizing, we can characterize the assessment metrics the following way:
Metric
What is measured
Risk assessment
Interpretation
Market Capitalization
Circulating supply * Price
Not possible
Trading attractiveness based on size and timing
Total Value Locked
Assets locked in smart contracts
Possible as a part of a broader strategy
Ecosystem traction based on value allocated
Audited badge
Whether project smart contracts were audited
Possible as a part of broader security posture analysis
The project smart contracts were audited, yet the nuances include audit relevancy and coverage
Proof or Reserves
Whether CEX holds sufficient assets to cover all user deposits, at least at a 1:1 ratio
Only as a part of broader risk assessment
The CEX has (or has not) enough funds to cover withdrawals. The operational risk posture is unknown.
Probability of Loss
98 assessments of risk posture, including TVL, MCAP, Audits, PoR, and more.
Designed solely for risk assessment
How project is exposed to risk based on data, including all mentioned in table metrics.
Most crypto metrics, considered as indicating risk (or risk mitigation) respond after damage is visible. Market cap tracks price. TVL tracks deposits. Audits review code. Proof of Reserves checks balances. Each was built around a specific failure that had already happened.
Probability of Loss starts from a different question: how do crypto projects actually fail?
Years of collapses, exploits, and rug pulls point to several recurring causes.
Operational breakdowns: no incident response plan, no key rotation, no separation of duties.
Financial fragility: thin liquidity, concentrated treasuries, and emissions that exceed demand.
Security gaps: no bug bounty, weak monitoring, and missing prevention systems.
Dependency risk: reliance on a single market maker or oracle that, if it disappears, takes the protocol with it.
Regulatory exposure: operating in jurisdictions that can shut the project down overnight without a license.
Reputational weakness: anonymous founders, no track record, no public accountability.
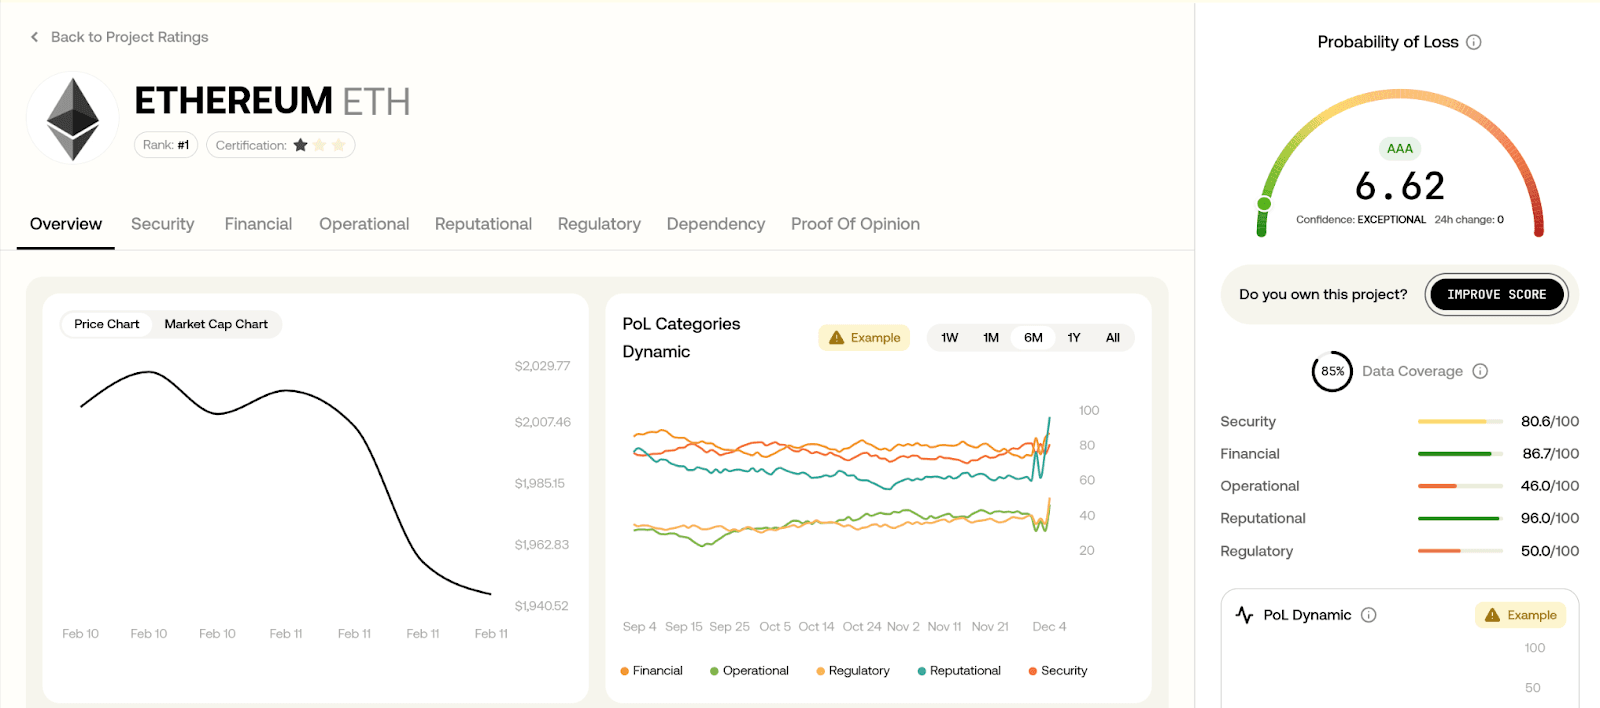
The probability of loss evaluates all of it. The output is a number from 0 to 100, where lower means more risk controls are in place and publicly verifiable. It doesn't predict price, and it doesn't promise safety.
It measures how many known risk controls a project has actually implemented and disclosed.
The difference is that PoL wasn't built after a single exploit. It was built from the full catalog of recurring failure modes.
What does the evolution of crypto risk management tell us?
The history is uncomfortable. In 2010, there were no metrics, and people relied on forum trust. In 2013, market cap arrived and quickly became a proxy for project quality. In 2019, TVL appeared and was treated as a health score. Each time, the market took the clearest available signal and treated it as the full picture.
It's tempting to blame investors for being naive, but the reality is more practical. For most of crypto's history, due diligence meant messy spreadsheets and manual research that didn't scale. The tools to measure risk across multiple dimensions didn't exist, the data wasn't organized, and no one had mapped the full list of ways projects fail in any structured way. Now, nearly two decades in, that history exists. The failure patterns are documented, and still, the causes repeat.
Market cap measures price. TVL measures deposits. Both measure something real. Neither measures risk.
Projects don't collapse because their TVL was too low. They collapse because of poor key management, weak internal controls, hidden dependencies, thin reserves, regulatory action, or founders who disappear.
Sometimes it's a honeypot built to trap funds from day one. Sometimes it's a single access control failure that drains hundreds of millions. Sometimes it's a shutdown order that the team never prepared for. Those risks sit below the surface, and no dashboard will show them.
The question of a deeper metric is already answered, even by several Web3 market participants, the probability of loss is one of them, offering math based on verifiable data, the only one that can be accessed freely. The other question is whether the market wants to stop wearing the rose-tinted glasses and see the real amount of risk it is exposed to now.